免费
2021-12-04
· 1 阅读
极简Flask与Bokeh可视化范例
后端代码 from flask import Flask , render_template from bokeh.embed import components from bokeh.plotting import figure from…
作者 · 考串
# 可视化
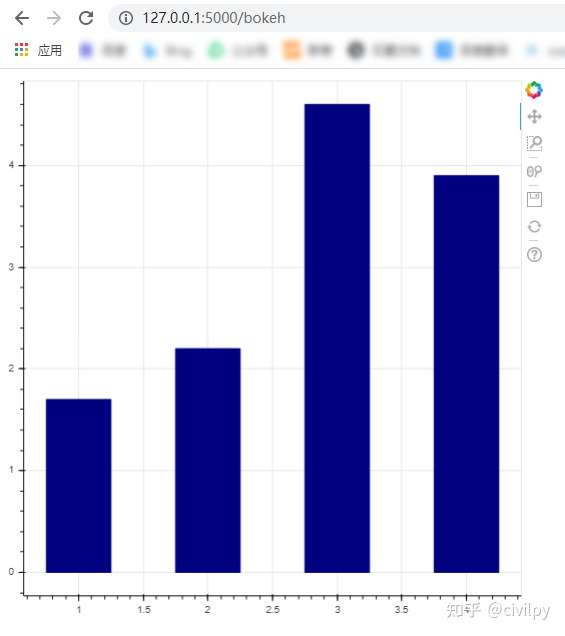
后端代码
from flask import Flask, render_template
from bokeh.embed import components
from bokeh.plotting import figure
from bokeh.resources import INLINE
from bokeh.util.string import encode_utf8

app = Flask(__name__)

@app.route('/')
def index():
    return 'Hello, World!'

@app.route('/bokeh')
def bokeh():
    # 绘制表格
    fig = figure(plot_width=600, plot_height=600)
    fig.vbar(
        x=[1, 2, 3, 4],
        width=0.5,
        bottom=0,
        top=[1.7, 2.2, 4.6, 3.9],
        color='navy'
    )
    # 表格转换
    js_resources = INLINE.render_js()
    css_resources = INLINE.render_css()
    script, div = components(fig)
    # 模板渲染
    html = render_template(
        'index.html',
        plot_script=script,
        plot_div=div,
        js_resources=js_resources,
        css_resources=css_resources,
    )
    return html


if __name__ == '__main__':
    app.run(debug=True)
前端代码
<!doctype html>
<html lang="en">
  <head>
    <meta charset="utf-8">
    <meta http-equiv="content-type" content="text/html; charset=utf-8">
    <title>Flask-Bokeh 交互</title>
    {{ js_resources|safe }}
    {{ css_resources|safe }}

  </head>
  <body>
	{{ plot_script|safe }}
    {{ plot_div|safe }}
  </body>
</html>
小结
同基于D3.js的plotly也出了一个Dash库,但是后端代码实在不够pythonic,笔者还是强烈推荐Bokeh,当然它也不是万能的,可视化主要是以业务为向导,附加美观、便于开发。